Environmental Debt Payment Periods and Growth Rates
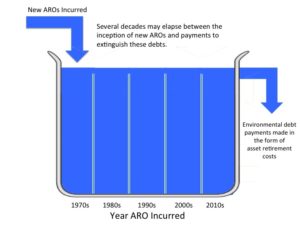
A bathtub is a useful metaphor for understanding ARO payment periods and growth rates. (Click here to view animated video.) The spigot adds new AROs into the tub where they accumulate for decades before eventually being drained from the tub. At any given time, the amount of water in the bathtub represents existing environmental debt. The water drained from the tub represents ARO payments.
Click to View Animated Video
The payment period is the number of years it will take to empty the tub with the spigot of new AROs turned off based on the assumed rate of flow through the drain. Oil and gas production assets are long-lived. For example, the average age of active production assets operating in the Gulf of Mexico is 30 years and counting. A bathtub that takes 30 years or more to fill takes a long time to empty, even if the spigot of new AROs is turned off.
The payment growth rate is analogous to the growth rate in the drain outflow over time. Over the long term, the growth rate in asset retirement costs (drain outflow) is largely determined by the growth rate of new AROs (spigot inflow). But in the short term, periods of retirement “deferral” and “catch up” could artificially decrease or increase the payment growth rate.
Historically, the rate of inflow through the spigot has been greater than the rate of outflow through the drain. Combined AROs for Exxon, Chevron, and ConocoPhillips increased from $8.4 billion in January 2003 to $39.3 billion in December 2015, a compounded annual growth rate of 13%. Over the past century the tub has been filling up in part due to deferred retirement of producing assets.
The common industry practice of deferring permanent asset retirement through temporary abandonment decreases the rate of drain outflow relative to spigot inflow. Retirement “deferral” periods eventually must be followed by “catch up” periods of increased retirement activity. For example, in 2010 the U.S. Department of Interior issued an “idle iron” order requiring oil and gas producers operating in the Gulf of Mexico to set permanent plugs in nearly 3,500 nonproducing completed wells and dismantle about 650 production platforms no longer being used. This regulatory action forced oil companies to permanently retire assets that had been “temporarily abandoned” for years and might otherwise have remained so for many years or decades longer.
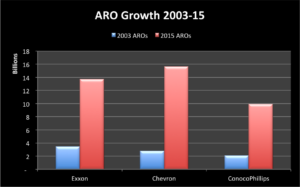
Average annual growth rate of 13%
Growing Capex increases the rate of ARO spigot inflow relative to drain outflow. The rapid growth in upstream Capex from 1999-2014 presages that oil companies will experience a surge of asset retirement costs in the future. Increasing asset retirement costs as a percentage of original Capex (the “ARO/Capex ratio”) would also increase the rate of spigot inflow relative to drain outflow. Studies are underway to determine the extent to which deeper wells, offshore production and unconventional onshore drilling have increased the ARO/Capex ratio over time.
The water volume in the tub also increases with time, independently of spigot inflow, due to factors such as inflation, asset damage, and increased regulation. For example, Preserv Offshore has reported that hurricane damage can increase decommissioning costs by 10x or more.
The 2003-15 compounded annual ARO payment growth rates for Exxon, Chevron and ConocoPhillips are 19.2%, 18.5% and 17.7%, respectively. Financial disclosures do not reveal the degree to which these rates reflect a pattern of “deferral” or “catch up” or other temporary factors. Can these high growth rates be expected to continue unabated into the future? Will they decline significantly? Could they go even higher?
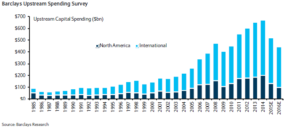
Upstream Capex (1985 – 2016)
One challenge in predicting future payment growth rates is that it’s easy to forget that oil companies are retiring assets today that were constructed several decades ago. When we look at the stars, we are seeing them as they were light years ago. Similarly, oil companies are retiring today assets put in service 30 or more years ago on average. If past experience holds, 30 or more years from now oil companies will be retiring assets put in place today. However, these new assets and the AROs associated with them are very different in type, scale and aggregate amount from the assets and AROs of three decades ago.